Ch4. Mixed Plot
이번 챕터에서는 여러 그래프들을 합쳐 복합적인 그래프를 그려보도록 하겠습니다. 어찌 보면, 쓸데 없이 High Quality 그래프들만 모아뒀으며, 시각적 효과대비 코드 작성 시간이 길어 가성비가 매우 떨어질 수 있습니다. 다만, 이런 것도 가능하다.를 보여주고 싶어, 이번 챕터를 구성하였습니다. 설명은 컨셉과 주요 명령어를 간단하게 소개하고, 그래프 및 코드를 보도록 하겠습니다.
데이터 생성 코드
x## Data FrameSurvival_Time = rnorm(n = 300, mean = 70, sd = 10)Censored = sample(0:1,300,replace = TRUE, prob = c(0.2,0.8))Age = runif(n= 300, min = 20, max = 80)Sex = rep(c("Male","Female"),c(200,100))Treatment = sample(c("Treated","Placebo"),300,replace = TRUE,prob = c(0.3,0.7))BTW = c(runif(200,30,90),runif(100,20,90))EVENT = sample(0:1,300,replace = TRUE, prob = c(0.8,0.2))SAMPLE = data.frame(Survival_Time = Survival_Time,Censored = Censored,Age = Age,Sex = Sex,Treatment = Treatment,BTW = BTW,EVENT = EVENT)
1. Bar + text plot
막대도표에 텍스트 값을 덮어서 표시한 그래프입니다.
xxxxxxxxxxSAMPLE %>%group_by(EVENT, Treatment) %>%summarise(N = length(EVENT)) %>%ggplot() +geom_bar(aes(x = as.factor(EVENT),y =N, fill = Treatment), stat='identity' ,position = position_dodge() ,alpha = 0.7) +geom_text(aes(x = as.factor(EVENT),y =N, label = N,fill = Treatment), vjust=1.6, color="white",position = position_dodge(0.9), size=3.5) +xlab("Event") + ylab(" ") +scale_x_discrete(breaks = c(0,1),labels = c("Survived","Death")) +scale_fill_manual(values = c('#999999','#E69F00')) +theme_classic()
2. Bar + Errorbar with Different Category Variable
서로 다른 명목형 변수를 하나의 축에 표시하는 그래프입니다.
막대도표에 error_bar 플랏을 추가하였습니다.
가끔 그래프 축 하나에 연령별 분포, 성별 분포 등 다른 변수들을 하나의 축에 넣고 싶을 때가 있습니다. 그런 경우, 데이터를 통합하여 만들어 놓고, 레이블링을 표시하는 순서대로 진행이 되는데 다음처럼 진행하면 됩니다.
xxxxxxxxxxSAMPLE$AGE_GROUP = ifelse(SAMPLE$Age < 40 , '~ Under 40',ifelse(SAMPLE$Age < 60, '~ Under 60','~ Under 80'))SEX = SAMPLE %>%group_by(Sex, Treatment) %>%summarise(MEAN = mean(BTW),sd = sd(BTW))AGE = SAMPLE %>%group_by(AGE_GROUP, Treatment) %>%summarise(MEAN = mean(BTW),sd = sd(BTW))TOTAL = rbind(SEX,AGE)TOTAL$OBS = c(1:4,6:11)TOTAL$SexTOTAL$AGE_GROUPxxxxxxxxxx> head(TOTAL)# A tibble: 6 x 6# Groups: Sex [3]Sex Treatment MEAN sd AGE_GROUP OBS<fct> <fct> <dbl> <dbl> <chr> <int>1 Female Placebo 49.6 19.4 NA 12 Female Treated 54.2 22.9 NA 23 Male Placebo 60.4 19.2 NA 34 Male Treated 63.2 17.2 NA 45 NA Placebo 57.0 19.3 ~ Under 40 66 NA Treated 60.9 17.3 ~ Under 40 7각 Category 수준에 따라 OBS(고유번호)를 지정해 준 다음에, OBS를 x축으로 하여 그래프를 그리고, 레이블링을 수정하는 방식으로 진행합니다.
xxxxxxxxxxggplot(TOTAL) +geom_bar(aes(x = OBS, y = MEAN, fill = Treatment),stat = 'identity',alpha = 0.8) +geom_errorbar(aes(x = OBS, ymin = MEAN - 0.2*sd,ymax = MEAN + 0.2*sd , col = Treatment)) +geom_text(aes(x = OBS ,y = MEAN , label = round(MEAN) ,fill = Treatment), vjust=3.5, color="white",position = position_dodge(0.9), size=5) +geom_point(aes(x = OBS, y = MEAN, fill = Treatment),stat = 'identity') +scale_fill_manual(values = c("#99CCFF","#0000CC")) +scale_color_manual(values = c("#FF0000","#FF9933")) +scale_x_continuous(breaks = c(1:4,6:11),labels = c("Female\n Placebo","Female\n Treated","Male\n Placebo","Male\n Treated","~ Under 40\n Placebo","~ Under 40\n Treated","~ Under 60\n Placebo","~ Under 60\n Treated","~ Under 80\n Placebo","~ Under 80\n Treated")) +xlab("") + ylab("") +ggtitle("Body Total Water") +theme_classic()
3. Boxplot + summary + Axis Customizing
코드가 많이 복잡하지만, 생각보다 간단하게 구성되었습니다.
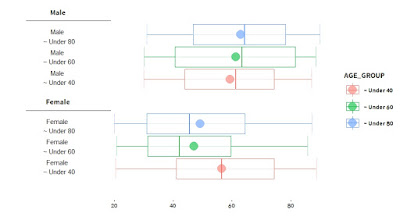
geom_boxplot()이 일반적인 박스플롯 명령어이지만, stat_boxplot()을 이용하여 박스플롯을 그리는 방법이 존재합니다. 이 경우, geom = 'errorbar' 옵션을 주면, 박스플롯 울타리가 직선이 아닌, error_bar 형태로 그려지는 것을 확인할 수가 있습니다.
stat_summary()는 그래프에 요약값을 나타내기 위한 명령어입니다. fun.y = mean옵션으로 평균점 위치를 표시해주며, 표시하는 방법은 geom = 'point'를 통해 점으로 표시할 수 있습니다.
xxxxxxxxxxggplot() +stat_boxplot(data = SAMPLE, aes(x = Sex, y = BTW, col = AGE_GROUP), alpha = 0.4,geom = 'errorbar') +stat_summary(data = SAMPLE,aes(x = Sex, y = BTW, col = AGE_GROUP, fill = AGE_GROUP),fun.y = mean,size= 10, geom="point", shape=20,position = position_dodge(width = .75)) +geom_boxplot(data = SAMPLE, aes(x = Sex, y = BTW, col = AGE_GROUP), alpha = 0.4) +theme_classic()여기서 축을 매우 이쁘게 수정해보도록 하겠습니다.
방법은 geom_text(), geom_errorbar()을 통해 한땀한땀 손수 그려주는 것입니다. geom_text()는 축 레이블을 직접 적어주기 위함이며, geom_errorbar()은 축 선을 그리기 위함입니다. 그리는 방법은 data = NULL을 준 후, 직접 x축, y축 위치를 지정해주어 그리는 것입니다.
xxxxxxxxxxggplot() +stat_boxplot(data = SAMPLE, aes(x = Sex, y = BTW, col = AGE_GROUP), alpha = 0.4,geom = 'errorbar') +stat_summary(data = SAMPLE,aes(x = Sex, y = BTW, col = AGE_GROUP, fill = AGE_GROUP),fun.y = mean,size= 10, geom="point", shape=20,position = position_dodge(width = .75)) +geom_boxplot(data = SAMPLE, aes(x = Sex, y = BTW, col = AGE_GROUP), alpha = 0.4) +geom_text(data = NULL,aes(x= 1.5, y= 1),label = "Female",family="SpoqaHanSans-Bold") +geom_errorbar(data = NULL,aes(x = 1.4, ymin = - 10,ymax= 19),width = 0,size = 0.4) +geom_text(data = NULL,aes(x= 0.77, y= 1),label = "Female \n ~ Under 40") +geom_text(data = NULL,aes(x= 1, y= 1),label = "Female \n ~ Under 60") +geom_text(data = NULL,aes(x= 1.23, y= 1),label = "Female \n ~ Under 80") +geom_text(data = NULL,aes(x= 2.5, y= 1),label = "Male",family="SpoqaHanSans-Bold") +geom_errorbar(data = NULL,aes(x = 2.4, ymin = - 10,ymax= 19),width = 0,size = 0.4) +geom_text(data = NULL,aes(x= 1.77, y= 1),label = "Male \n ~ Under 40") +geom_text(data = NULL,aes(x= 2, y= 1),label = "Male \n ~ Under 60") +geom_text(data = NULL,aes(x= 2.23, y= 1),label = "Male \n ~ Under 80") +coord_flip() +theme_classic() +xlab("") + ylab("") +scale_x_discrete(breaks = NULL) +scale_y_continuous(breaks = seq(20,100,by = 20)) +theme(text=element_text(family="SpoqaHanSans-Bold"),axis.line.x = element_blank())
4. Boxplot + Difference Test
박스플롯에 차이 검정 결과를 넣어 주는 geom_boxplot()의 확장 명령어인 ggboxplot()입니다.
xxxxxxxxxxlibrary(ggpubr)SAMPLE$AGE_GROUP = as.factor(SAMPLE$AGE_GROUP)my_comparisons <- list( c("~ Under 40", "~ Under 60"), c("~ Under 40", "~ Under 80"),c("~ Under 60", "~ Under 80"))ggboxplot(SAMPLE, x = 'AGE_GROUP', y = 'BTW',color = 'AGE_GROUP', palette = "jco", bxp.errorbar = TRUE ) +stat_boxplot(geom = 'errorbar', data = SAMPLE, aes(x = AGE_GROUP, y = BTW,color = AGE_GROUP)) +stat_compare_means(comparisons = my_comparisons) +stat_compare_means(label.y = 120)
Ch5. Modeling Visualization
이번 챕터는 각 분석 별로 파생되어 나오는 그래프들에 대해 소개해드리도록 하겠습니다. 시각화 방법만 다루고 있으므로 모형에 대한 해석은 진행하지 않습니다. (애초에 난수 데이터여서 데이터가 정확하지도, 결과값이 깔끔하게 나오지도 않습니다.)
1. Survival Plot
생존분석을 진행한 후, ggsurvplot()을 이용하여 그래프를 그리도록 하겠습니다.
xxxxxxxxxxlibrary(survival)library(survminer)fit<- survfit(Surv(Survival_Time, EVENT) ~ Treatment ,data = SAMPLE)ggsurvplot(fit,conf.int = TRUE)xxxxxxxxxxggsurvplot(fit, data = SAMPLE, risk.table = TRUE,pval = TRUE, conf.int = TRUE,tables.theme = theme_cleantable())
2. PSM
매칭 되기 전과, 매칭 된 후의 데이터 분포 비교를 진행하겠습니다.
cowplot패키지의 plot_grid()를 이용하면 두 개의 ggplot 그래프를 합칠 수가 있습니다.
xxxxxxxxxx# PSM 진행library(MatchIt)Matched <- matchit(EVENT ~ Age +Sex +BTW +Treatment +Survival_Time, data = SAMPLE, ratio = 1, caliper = 0.1)matched.1.mtch <- match.data(Matched)xxxxxxxxxxSAMPLE2 = SAMPLE %>%group_by(Age,Sex) %>%summarise(BTW = mean(BTW))Before = ggplot(SAMPLE2) +geom_bar(data = subset(SAMPLE2,Sex =='Male'),aes(x = round(Age), y = BTW ,fill = Sex), stat = 'identity') +geom_bar(data = subset(SAMPLE2,Sex =='Female'),aes(x = round(Age), y = - BTW , fill = Sex), stat = 'identity') +coord_flip() +theme_minimal() + xlab("Age") +scale_fill_manual(values = c("#FF3333", "#0000FF"))+theme(legend.position = c(0.9,0.1)) +ggtitle("Before Matching")Matched2 = matched.1.mtch %>%group_by(Age,Sex) %>%summarise(BTW = mean(BTW))After = ggplot(Matched2) +geom_bar(data = subset(Matched2,Sex =='Male'),aes(x = round(Age), y = BTW ,fill = Sex), stat = 'identity') +geom_bar(data = subset(Matched2,Sex =='Female'),aes(x = round(Age), y = - BTW , fill = Sex), stat = 'identity') +coord_flip() +theme_minimal() + xlab("Age") +scale_fill_manual(values = c("#FF3333", "#0000FF"))+theme(legend.position = c(0.9,0.1)) +ggtitle("After Matching")library(cowplot)plot_grid(Before,After)
3. Sinkey Chart
특별한 분석이 들어가는 차트는 아니지만, 환자들의 치료 여부에 따라 이벤트 발생 여부 흐름을 시각화 할 수 있는 차트입니다.
xxxxxxxxxxlibrary(ggalluvial)ggplot(SAMPLE,aes(y = BTW,axis1 = Censored, axis2 = Treatment, axis3 = EVENT)) + geom_alluvium(aes(fill = Sex),width = 0, knot.pos = 0, reverse = FALSE) + guides(fill = FALSE) + geom_stratum(width = 1/8, reverse = FALSE) + geom_text(stat = "stratum", label.strata = TRUE, reverse = FALSE) + scale_x_continuous(breaks = 1:3, labels = c("Censored", "Treatment", "Event")) + coord_flip() + theme_classic()
4. Forest Plot
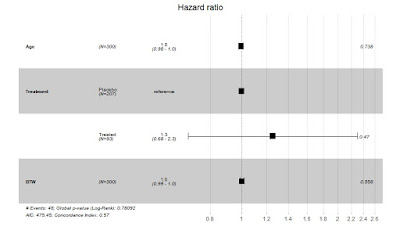
Forest Plot은 Cox Regression혹은 메타분석 결과를 표현하는데 주로 사용합니다. 작성방법은 매우 간단합니다.
xxxxxxxxxxlibrary(survival)model <- coxph( Surv(Survival_Time, EVENT) ~ Age + Treatment + BTW, data = SAMPLE )ggforest(model)5. Network Plot
Network Plot은 각 변수 별 동시 등장빈도, 혹은 상관계수를 이용하여 그릴 수가 있습니다.
데이터 생성
xxxxxxxxxxx1 = rnorm(mean = 0,sd = 5, 150)x2 = rnorm(mean = 0,sd = 5, 150)x3 = rnorm(mean = 0,sd = 5, 150)x4 = rnorm(mean = 0,sd = 5, 150)x5 = rnorm(mean = 0,sd = 5, 150)x6 = rnorm(mean = 0,sd = 5, 150)x7 = rnorm(mean = 0,sd = 5, 150)x8 = rnorm(mean = 0,sd = 5, 150)x9 = rnorm(mean = 0,sd = 5, 150)x10 = rnorm(mean = 0,sd = 5, 150)x11 = rnorm(mean = 0,sd = 5, 150)x12 = rnorm(mean = 0,sd = 5, 150)x13 = rnorm(mean = 0,sd = 5, 150)x14 = rnorm(mean = 0,sd = 5, 150)x15 = rnorm(mean = 0,sd = 5, 150)x16 = rnorm(mean = 0,sd = 5, 150)DataFrame = data.frame(x1 = x1,x2 = x2,x3 = x3,x4 = x4,x5=x5,x6=x6,x7=x7,x8 = x8,x9 = x9, x10 = x10, x11 = x11, x12 = x12, x13 = x13,x14 = x14, x15 = x15, x16 = x16)library(dplyr)library(reshape)Cor_matrix= DataFrame %>%select_if(is.numeric) %>%cor()NETWORK_DF = melt(Cor_matrix)네트워크 데이터 변환
xxxxxxxxxxlibrary(ggraph)network = graph_from_data_frame(NETWORK_DF,directed = FALSE)Basic Network Plot
xxxxxxxxxxplot(network)geom_edge_linke()등의 명령어를 사용하면 더욱화려하게 그릴 수가 있습니다.
xxxxxxxxxxggraph(network) +geom_edge_link(col= 'grey',alpha = 0.4) +geom_node_point(color = "grey", size = 4,alpha = 0.4) +geom_node_text(aes(label = name,col = name), repel = TRUE, size = 8) +theme_graph() +labs(title = "Correlations between variables") +guides(col = FALSE)x
ggraph(network) +geom_edge_link(aes(edge_alpha = abs(value), edge_width = abs(value), color = value)) +guides(edge_alpha = "none", edge_width = "none") +scale_edge_colour_gradientn(limits = c(-1, 1), colors = c("firebrick2", "dodgerblue2")) +geom_node_point(color = "white", size = 5) +geom_node_text(aes(label = name), repel = TRUE) +theme_graph() +labs(title = "Correlations between variables")


댓글
댓글 쓰기