Ch2. ggplot2 기본
1. ggplot2 기본 작성 순서
xlibrary(ggplot2)Graph = ggplot(STOCK) + geom_histogram(aes(x = Open), binwidth = 1000, fill = 'royalblue', alpha = 0.4) + theme_bw() + xlab("개장 주가") + ylab("") + ggtitle("Histogram")Graph그래프 작성 방법은 앞에서 다룬 것과 같이 축, 그래프 옵션 설정 순서로 작성하면 됩니다.
2. 테마 변경
테마는 ggplot2에서 바탕색을 변경하는 옵션입니다. ggplot2에 기본적으로 내장되어 있는 테마는 다음과 같습니다.
xxxxxxxxxxGraph + theme_bw() + ggtitle("Theme_bw") Graph + theme_classic() + ggtitle("Theme_classic") Graph + theme_dark() + ggtitle("Theme_dark") Graph + theme_light() + ggtitle("Theme_light") xxxxxxxxxxGraph + theme_linedraw() + ggtitle("Theme_linedraw") Graph + theme_minimal() + ggtitle("Theme_minimal") Graph + theme_test() + ggtitle("Theme_test") Graph + theme_void() + ggtitle("Theme_vold") ggplot2의 경우에는 ggplot2와 함께 사용할 수 있는 패키지들이 있습니다. 테마관련해서는 "ggthemes" 패키지를 활용하면 더 많은 종류의 테마를 적용시킬 수 있습니다.
xxxxxxxxxx# 패키지 부착 (설치 필요합니다.)library(ggthemes)xxxxxxxxxxGraph + theme_stata() + ggtitle("Theme_stata") Graph + theme_economist() + ggtitle("Theme_economist") Graph + theme_economist_white() + ggtitle("Theme_economist_white") Graph + theme_wsj() + ggtitle("Theme_wsj") xxxxxxxxxxGraph + theme_calc() + ggtitle("Theme_calc") Graph + theme_base() + ggtitle("Theme_base") Graph + theme_excel() + ggtitle("Theme_excel") Graph + theme_excel_new() + ggtitle("Theme_excel_new") xxxxxxxxxxGraph + theme_few() + ggtitle("Theme_few") Graph + theme_fivethirtyeight() + ggtitle("Theme_fivethirtyeight") Graph + theme_foundation() + ggtitle("Theme_foundation") Graph + theme_gdocs() + ggtitle("Theme_gdocs") xxxxxxxxxxGraph + theme_hc() + ggtitle("Theme_hc") Graph + theme_igray() + ggtitle("Theme_igray") Graph + theme_map() + ggtitle("Theme_map") Graph + theme_pander() + ggtitle("Theme_pander") xxxxxxxxxxGraph + theme_solarized() + ggtitle("Theme_solarized") Graph + theme_solarized_2() + ggtitle("Theme_solarized_2") Graph + theme_solid() + ggtitle("Theme_solid") Graph + theme_tufte() + ggtitle("Theme_tufte") 3. 범례(Legend) 변경
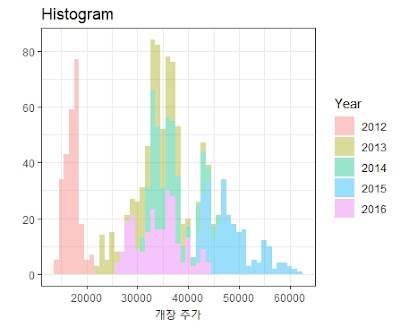
xxxxxxxxxxGraph2 = ggplot(STOCK) + geom_histogram(aes(x = Open, fill =Year), binwidth = 1000, alpha = 0.4) + xlab("개장 주가") + ylab("") + ggtitle("Histogram") + theme_bw()Graph2범례 제목 변경
범례 제목을 변경하는 명령어는 labs() 명령어를 주로 사용합니다.
xxxxxxxxxxGraph2 + labs(fill = "년도")범례 위치 변경
xxxxxxxxxxGraph2 + theme(legend.position = "top")Graph2 + theme(legend.position = "bottom")Graph2 + theme(legend.position = c(0.9,0.7))Graph2 + theme(legend.position = 'none') 범례의 위치는 theme() 명령어 내부에 legend.position 옵션을 변경해줌으로써 수정할 수가 있습니다. 만약 그래프 내부에 범례를 위치시킬 경우, x, y 축의 위치 좌표를 설정해주어야 하는데, 설정 범위는 x,y축 모두 0 ~ 1사이의 비율값으로 위치를 지정해줍니다. 제가 설정한 legend.position = c(0.9,0.7)은 x축의 90% y축의 80% 위치에 범례를 표시하겠다라는 의미입니다.
4. 축 변경
축 변경의 경우, 가장 먼저 신경써야 할 부분은 축에 설정된 변수가 Discrete인지 Continuous인지 확인부터 해야합니다.
- x축 Discrete : scale_x_discrete()
- x축 Continous : scale_x_continuous()
- y축 Discrete : scale_y_discrete()
- y축 Continuous : scale_y_continuous()
축 간격 표시 수정
xxxxxxxxxxGraph2 + scale_x_continuous(breaks = seq(0,70000,by=10000))Graph2 + scale_x_continuous(breaks = NULL)- breaks는 축에 숫자 간격 표시를 어떻게 할 것인지 정해주는 옵션입니다. 만약 NULL을 입력하면 축 숫자는 그래프에 표시가 되지 않습니다.
축 범위 조정
xxxxxxxxxxGraph2 + scale_x_continuous(limits = c(0,50000))축 레이블 수정
xxxxxxxxxxGraph3 = ggplot(Group_Data) +geom_bar(aes(x = Year, y= Mean, fill = Year),stat = 'identity', alpha = 0.4) +theme_classic()해당 그래프는 2012, 2013 이렇게 숫자로 축 및 레이블이 표시되어 있습니다. 보기에 불편할 수도 있으니 12년, 13년 형식으로 바꿔보도록 하겠습니다.
xxxxxxxxxxGraph3 +scale_x_discrete(label = c("12년도","13년도","14년도","15년도","16년도")) +scale_fill_discrete(label = c("12년도","13년도","14년도","15년도","16년도"))- scale_x_discrete(label = c())을 통해 Discrete 변수로 구성되어 있는 x축 레이블을 변경할 수 있습니다.
- sacle_fill_discrete(label = c())을 통해 범례 내용도 수정할 수가 있습니다. 만약 색이 fill()이 아닌 col()를 통해 구분되어 있다면 scale_col_discrete(label=c())를 활용하면 문제 없이 바꿀 수가 있습니다.
5. 색 변경
R에서는 기본적으로 색 분류가 지정되어 있습니다. 하지만 가끔 색을 직접 변경을 해주고 싶은 경우가 존재합니다.
Discrete 변수를 기준으로 색을 지정할 떄는 scale_fill_manual()혹은 scale_color_manual()을 활용하면 원하는 색 배치를 배정할 수 있습니다.
xxxxxxxxxxGraph3 +scale_fill_manual(values = c('red','royalblue','tan','violetred','tan3'))Continuous 변수를 기준으로 색을 지정할 때는 색을 그라이데이션으로 구분을 지어줄 수 있습니다.
xxxxxxxxxxggplot(STOCK) +geom_histogram(aes(x = Open, fill = ..x..), binwidth = 1000, alpha = 0.4) +xlab("개장 주가") + ylab("") + ggtitle("Histogram") +theme_classic() +scale_fill_gradient(low = 'blue', high = 'red') +labs(fill = "Gradientn")ggplot(STOCK) +geom_histogram(aes(x = Open, fill = ..x..), binwidth = 1000, alpha = 0.4) +xlab("개장 주가") + ylab("") + ggtitle("Histogram") +theme_bw() +scale_fill_gradientn(colors = c('royalblue','red','yellow'),values = c(0,0.8,1)) +labs(fill = "Gradientn")- ..x..는 x축 변수를 기준으로 색을 배분하겠다는 의미입니다. 만약, y값을 기준으로 색을 배분하고 싶은 경우에는 Histogram은 y축이 count이기 때문에 ..x..대신 ..count..를 쓰면 됩니다.
6. 글씨체 변경
그래프에는 기본적으로 x축, y축, 제목, 범례에 글씨(text)가 쓰입니다. 그래프에서 글씨체를 변경하는 방법은 theme()명령어 안에 각 텍스트 별로 옵션을 주는 방법이 있습니다.
폰트 다운받기
먼저, 다양한 폰트를 활용하기 위해서 extrafont() 패키지를 설치한 후, font_install()을 통해 폰트를 다운받아야 합니다. 폰트를 다운받는 시간은 꽤 걸리기 때문에 조금 인내심을 가지고 기다려주셔야 합니다. 폰트를 다운 받은 이후에는 loadfonts()를 통해 폰트를 불러와야 합니다.
xxxxxxxxxx # 폰트 불러오기= # install.packages("extrafont") library(extrafont) # font_import() font_install() loadfonts(device = "win")ggplot2에 폰트 적용하기
xxxxxxxxxxGraph2 +ggtitle("LaTex Fonts") +theme(axis.text.x = element_text(size = 10,family="SpoqaHanSans-Bold"),axis.text.y = element_text(size = 12,family = "LM Roman 10"),axis.title.x = element_text(size = 14),plot.title = element_text(size = 20,family = "LM Roman 10"),legend.title = element_text(size = 10,family = "SpoqaHanSans-Bold"),axis.ticks.x = element_blank(),axis.ticks.y = element_blank())
7. 그래프 분할 및 대칭 변환
그래프를 범례 별로 다르게 표시하고 싶은 경우, facet_wrap()을 사용하고, x축과 y축을 대칭이동을 하고 싶은 경우에는 coord_flip()을 이용하면 매우 쉽게 그래프를 표현할 수 있습니다.
xxxxxxxxxxGraph2 + facet_wrap(~ Year, ncol = 1)Graph2 + coord_flip()- facet_wrap()은 그래프를 분할하고 싶은 변수의 기준을 입력해준 다음, ncol 옵션을 통해서 몇 개의 열로 표현할지 정해야 합니다. 현재는 ncol = 1을 주었는데 이렇게 되면 그래프를 열 1개로 나열한다는 의미가 됩니다. Year 변수는 총 5개 년도가 있어, 5개의 그래프로 분할이 되는데, 열이 1개이니 자연스럽게 5 * 1형태로 그래프가 나열됩니다.
- coord_flip()을 추가해주면 그래프가 x축, y축이 대각선 대칭이 되어 그래프가 작성이 됩니다.
여기까지 자주 쓰이는 ggplot2 옵션 설정에 대해서 다루었습니다. 물론 더 많은 기능들이 있지만, 모두 다루기에는 양이 매우 방대하며 필요 수준 이상으로 다루는 것이기에 이정도만 다뤘습니다.


댓글
댓글 쓰기